Logging that doesn’t cost more than the application
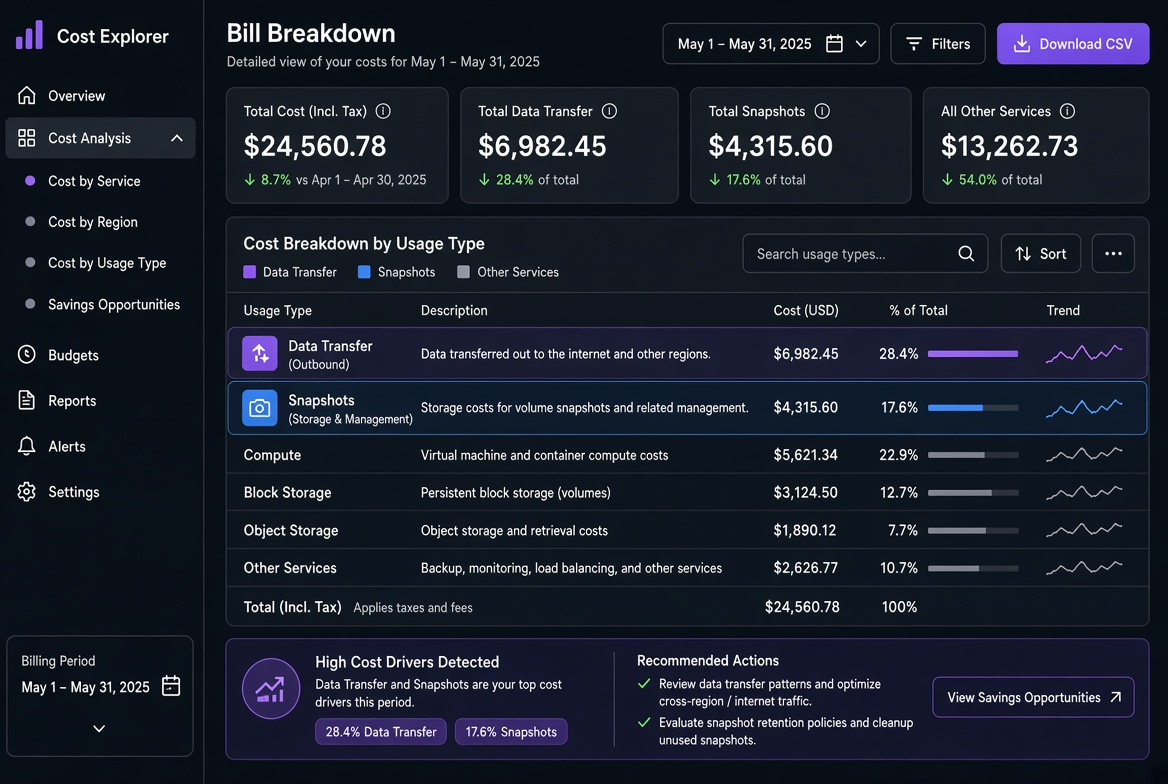
I have seen logging bills exceed the cost of the application they were meant to observe. The pattern is always the same: default “log everything at debug,” long retention, full-text indexing on high-cardinality fields, and egress to a central collector that charges by the GB. The fix is not “log less and hope.” It is deliberate volume control, retention that matches the actual investigation window, and cheaper paths for the bulk of the data.
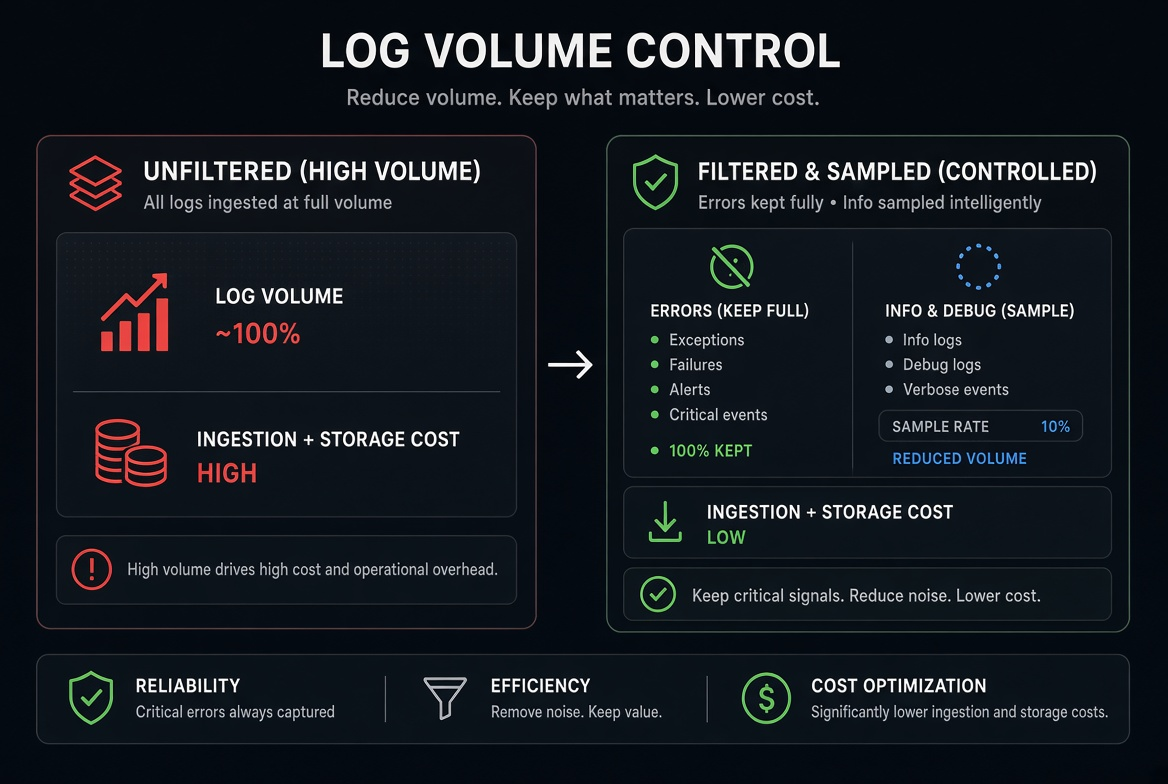
One service I inherited was emitting full request and response bodies at info level. After a traffic spike the daily log volume hit 12 TB. The observability bill that month was higher than the compute + database bill combined. We kept 100 % of errors and a 1 % sample of successful requests with bodies stripped; the signal for debugging stayed intact and the log cost dropped by more than 90 %.
Where the money actually goes
- Ingestion / processing fees per GB
- Storage for the retained period
- Indexing or query-time scan costs
- Egress from the source region or from the log platform to the analytics tool
- High-cardinality labels that explode the time-series or index size
A single chatty microservice that emits 50 KB of structured logs per request at 1 000 RPS produces roughly 4 TB per day before compression. At typical cloud-log prices that is already a material line item; after indexing and 30-day retention it becomes painful.
Sampling and filtering that preserve the signal
I keep 100 % of errors, warnings and audit events. Everything else is sampled or filtered at the source.
# Example: Fluent Bit or similar – keep all errors, sample info at 5 %
# (exact syntax depends on the agent; the principle is the same)
[FILTER]
    Name   grep
    Match  *
    Regex  level error|warn|audit

[FILTER]
    Name   throttle
    Match  *
    Rate   50
    Window 10
    Interval 5s
Application-level sampling (e.g. OpenTelemetry tail sampling or a simple probabilistic sampler) is even better because it can keep the full trace context for the sampled requests.
Retention that matches how you actually debug
Most investigations happen in the first 24–72 hours. Keeping 90 days of high-resolution logs “just in case” is expensive insurance. I use tiered retention:
- Hot (searchable, full index): 7–14 days
- Warm (cheaper storage, slower query): 30–90 days
- Cold / archive (object storage, rare restore): longer only if required
Moving a log stream from hot to warm after 14 days routinely cuts the storage component by more than half with almost no impact on day-to-day debugging.
Cheaper destinations for the bulk
Not every log line needs to live in the most expensive observability backend. High-volume, low-value streams (access logs, debug traces, verbose third-party library output) can go to cheap object storage or a lightweight columnar store, with only the error and audit subset shipped to the primary platform.
A simple pattern: agent → cheap object storage (with lifecycle) for the full volume, plus a filtered firehose to the expensive backend for the 5–10 % that actually gets queried.
Measuring and owning the cost
I treat log volume as a first-class metric. Every service publishes an approximate daily GB emitted; the monthly review includes the top emitters and whether their volume is still justified. When a new feature doubles the log output, the cost appears on the same dashboard as the feature’s compute cost.
The Logging / Egress calculator is useful before a new service is enabled for full debug logging. After the first week of real traffic the measured volume replaces the estimate and the retention / sampling decisions are adjusted.
Logging is essential. Unlimited, unfiltered, long-retention logging is not. Once volume, retention and destination are treated as design choices rather than defaults, the bill stops competing with the application itself.
I also run a quarterly “log diet” review: top 10 emitters by GB, current sampling rate, retention tier, and whether any high-cardinality fields can be dropped or hashed. The review takes an hour and routinely finds another 20–30 % of avoidable cost.
When a new service is designed I ask for the expected log volume at peak and the required retention for compliance or debugging. Those two numbers go into the same cost model as the compute estimate. If the logging line is larger than the compute line on day one, we fix the logging design before launch instead of after the first invoice.