Why your first cloud bill is always higher than the calculator
Every pricing calculator is optimistic. You type in the instance size, the region, a rough storage number, maybe a little data transfer, hit calculate, and get a tidy monthly figure. Then the first real invoice arrives and it is 30–80 % higher. The difference is almost never the compute itself. It is the line items the calculator either hides behind defaults or does not surface until you have already generated the traffic.
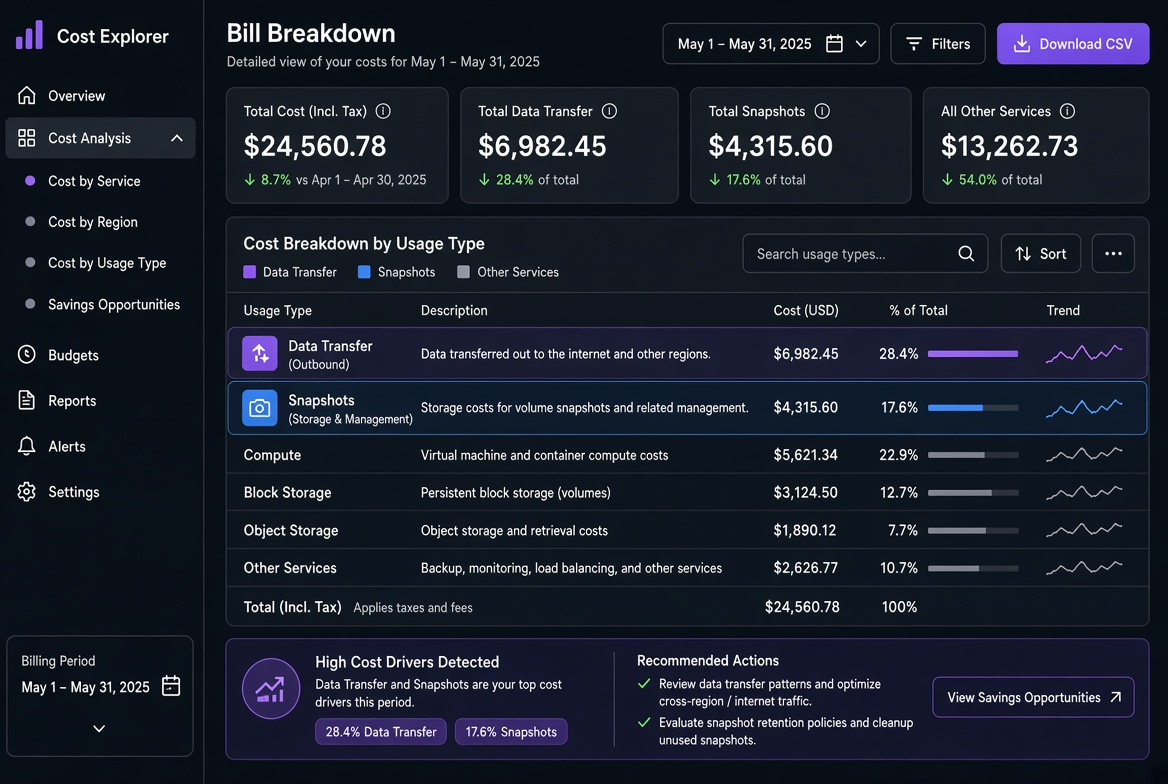
I have spent enough late nights staring at Cost Explorer (and the equivalent pages on other clouds) to recognise the usual suspects. The list below is the order I now check when a new environment’s first bill looks wrong. The same pattern appears whether the cloud is AWS, GCP, Azure, or a smaller provider: the compute line is close to the estimate, everything else drifts.
One early project of mine had a calculator total of roughly $180. The first invoice was $312. Almost the entire gap was inter-AZ traffic between the app tier and a managed database, plus a NAT gateway that had been left from an earlier networking experiment. Once those two items were visible, the fix was straightforward. Until they were visible, we just kept arguing about instance sizes.
Data transfer is the biggest silent multiplier
Most calculators show “data transfer out to the internet” as a single cheap tier. Real life is messier.
- Cross-AZ traffic inside the same region is charged on many providers even if both instances are private.
- Traffic that leaves through a NAT gateway is charged both for the gateway hours and for the data processed.
- Object storage downloads, container registry pulls, and log shipping all count as egress.
- Inter-region replication of snapshots or databases is often billed at a higher rate than internet egress.
A simple pattern that repeatedly surprises people: an application that talks to a managed database in a different AZ, plus a few GB of logs shipped to a central collector, can add more to the bill than the database instance itself.
When the number is large, the first tool I reach for is the provider’s traffic or Cost Explorer breakdown filtered by “Data Transfer” or “Egress”. Tagging every resource with env and service from day one makes the filter usable; without tags you are left guessing which component produced the bytes.
Another frequent source: container images pulled from a public registry on every deploy or scale event. Each pull is egress from the registry’s perspective and ingress + sometimes processing charges on your side. Caching the images in a private registry or using a pull-through cache cuts that line dramatically, but only after you notice it exists.
Snapshots and backups that grow while you sleep
Snapshot storage is incremental on most clouds, but the first full snapshot of a 500 GB volume is still 500 GB of billable storage. If you leave the default retention (or set “keep forever” during a weekend experiment), the bill keeps rising even after the instance is stopped.
Cross-region copy multiplies the cost again. I have seen teams turn on “copy snapshots to another region for DR” and only notice three months later when the secondary region storage line was larger than the primary compute.
Quick check that has saved me more than once:
# AWS example – list snapshots older than 30 days that are not tagged keep=true
aws ec2 describe-snapshots --owner-ids self \
  --query 'Snapshots[?StartTime<=`2026-07-01`].{ID:SnapshotId,Time:StartTime,Size:VolumeSize,Desc:Description}' \
  --output table
Equivalent commands exist for the other major clouds. The point is the same: snapshot storage is not free, and the calculator rarely models your actual retention policy.
Public IPs and idle NAT gateways
An Elastic IP / static public IP that is allocated but not associated with a running instance is charged on most providers. A NAT gateway that was created for a temporary private subnet and then left running continues to cost hourly plus every byte that still happens to flow through it.
These are classic “I thought I deleted that” items. The calculator assumes you only pay for what you explicitly selected; the real bill charges for everything that still exists in the account.
A practical habit: once a month I run a short inventory of unattached resources.
# AWS-style examples – adapt to your cloud’s CLI
aws ec2 describe-addresses --query 'Addresses[?AssociationId==null].PublicIp' --output text
aws ec2 describe-nat-gateways --filter Name=state,Values=available --query 'NatGateways[*].NatGatewayId'
The output is usually short. Any entry that has been sitting there for more than a few days is worth a second look.
Logging and monitoring egress
Cloud logging services often charge for ingestion, storage, and the data transferred out when you query or ship the logs elsewhere. A default “send everything to the central log group” configuration on a chatty application can generate more egress and ingestion cost than the application’s own traffic.
I now treat log volume as a first-class cost signal. If the application is not yet in production, I keep retention short (7–14 days) and sampling aggressive until we know which fields actually matter.
Metrics and traces follow the same pattern. High-cardinality labels or default “scrape everything every 15 seconds” configurations look harmless in the documentation and expensive on the invoice. The calculator rarely has a line for “Prometheus remote-write of 200 000 active series”.
A quick diagnostic I use:
# Example: rough daily log volume if you have a central collector
# (replace with your actual log pipeline query)
# Look for sudden jumps that coincide with new services or debug flags left on
When the logging line is large, the fix is almost always “less volume or cheaper destination”, not “bigger instance”.
How I locate the gap between calculator and invoice
- Open the billing console / Cost Explorer for the previous full month.
- Group by service, then by usage type that contains “DataTransfer”, “Snapshot”, “PublicIP”, “NatGateway”, “Log”.
- If tags were applied, filter or group by
env=prodvsenv=devand by service name. - For any large data-transfer line, drill into the resource IDs or the AZ pairs.
- Cross-check with the provider’s traffic accounting pages or VPC Flow Logs if the numbers still look wrong.
The Egress calculator on this site is useful before you open ports or enable cross-region replication; it will not catch a forgotten NAT gateway or an untagged snapshot, but it forces you to put a number on the traffic you expect. After the first real bill, the same numbers become the baseline you compare against.
I also recommend writing the expected traffic assumptions into the architecture decision record or the Terraform comments. Six months later, when someone asks why the bill is higher, you can point to the original assumption and the actual measured volume instead of reconstructing history from memory.
A short checklist I run after every new environment’s first invoice
- Are there unattached public IPs?
- Are there NAT gateways with near-zero traffic but non-zero hourly charge?
- What is the snapshot storage total, and does the retention policy match what we actually need?
- Which services appear under Data Transfer, and do the magnitudes match the architecture diagram?
- Are logs being retained longer than necessary or shipped to a second region unintentionally?
- Did any “free tier” or promotional credit mask part of the real usage in the first partial month?
None of these require exotic tools. They require looking at the bill with the same care you look at the architecture diagram. The calculator is a starting point. The first invoice is the first real measurement. Treat the difference as a signal, not a surprise, and the second month’s bill usually lands much closer to the number you originally expected.
For teams that already use infrastructure-as-code, I also add a post-apply cost estimation step (Infracost or the provider’s own estimator) and a mandatory tag policy. The estimation still will not catch runtime traffic, but it removes the “we forgot the multi-AZ database was going to double storage and IOPS” class of surprises before the code is even merged.
If the gap is mostly egress, plug the observed traffic volumes back into the Egress calculator and decide whether a CDN, private connectivity, or simply less chatty logging is the cheaper fix. The numbers only become manageable once they are visible.
I also keep a simple text note for each environment: “Calculator said X. First invoice Y. Main deltas: A, B, C.” After three or four environments the pattern becomes obvious and the next calculator estimate starts with those deltas already baked in. The goal is not to make the calculator perfect; it is to make the first real bill no longer a surprise.
One last observation from the trenches: the teams that complain least about “the bill is always higher” are the ones that look at Cost Explorer (or the equivalent) in the first week, not the first month. Early visibility turns a 40 % overrun into a two-hour investigation instead of a post-mortem.
Related tools
Cloud Data Egress Cost Calculator
Estimate monthly internet and cross-region data-transfer cost from a source region.
Small Cloud VM Cost Calculator
Compare small Linux VMs on AWS T3, Azure B-series, Google E2, and DigitalOcean Droplets, including transfer.
Object Storage Cost Calculator
Break down storage, requests, retrieval, and egress for S3, Blob, GCS, and R2.